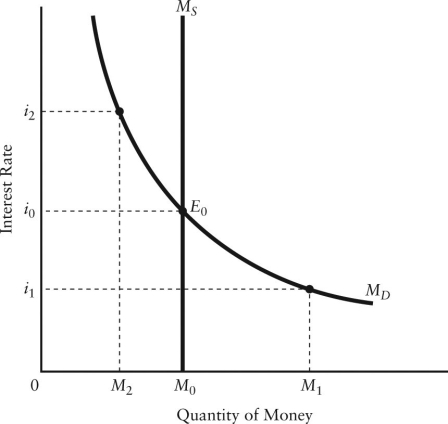
Solved

FIGURE 27-2 -Refer to Figure 27-2. Starting at Equilibrium E0, an Increase

Question 72

Multiple Choice

  FIGURE 27-2 -Refer to Figure 27-2. Starting at equilibrium E0, an increase in real GDP will lead to a A)  shift of the MS curve to the left and an increase in the interest rate. B)  shift of the MS curve to the right and a fall in the interest rate. C)  downward movement along the MD curve and a lower interest rate. D)  shift of the MD curve to the left and a fall in the interest rate. E)  shift of the MD curve to the right and an increase in the interest rate. FIGURE 27-2
-Refer to Figure 27-2. Starting at equilibrium E0, an increase in real GDP will lead to a


A) shift of the MS curve to the left and an increase in the interest rate.
B) shift of the MS curve to the right and a fall in the interest rate.
C) downward movement along the MD curve and a lower interest rate.
D) shift of the MD curve to the left and a fall in the interest rate.
E) shift of the MD curve to the right and an increase in the interest rate.

Correct Answer:

verifed

Verified

Unlock this answer now
Get Access to more Verified Answers free of charge

Related Questions

Unlock this Answer For Free Now!

View this answer and more for free by performing one of the following actions

qr-code

Scan the QR code to install the App and get 2 free unlocks

upload documents

Unlock quizzes for free by uploading documents