FIGURE 24-5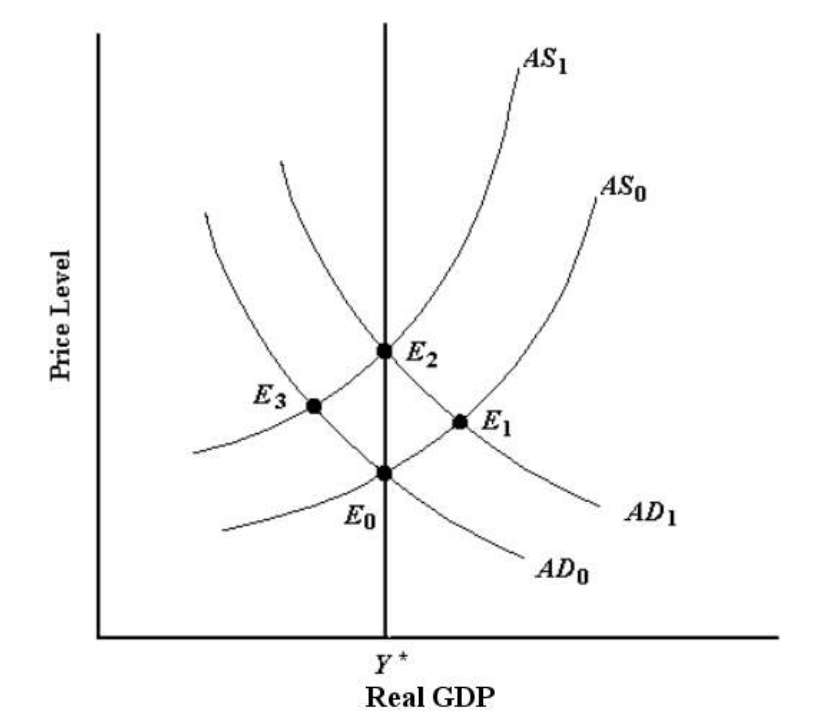
-Refer to Figure 24-5.Following a positive demand shock that takes the economy from E0 to E1,the movement of the economy from E1 to E2 indicates that
A) a demand shock can keep real GDP above potential output permanently.
B) an increase in the price level causes the AS curve to shift to the left.
C) an increase in the price level causes the AD curve to shift to the left.
D) the economy cannot return to potential output without government intervention.
E) the output effect of a demand shock will be reversed in the long run when wages and prices are fully adjusted.
Correct Answer:
Verified
Q63: The diagram below shows an AD/AS model
Q68: FIGURE 24-5 Q71: FIGURE 24-5 Q81: The diagram below shows an AD/AS model Q82: The diagram below shows an AD/AS model Q84: Consider the AD/AS model.In the long run,after Q85: In the long run in the AD/AS Q85: Suppose the economy begins in a long-run Q94: Consider the AD/AS model after factor prices Q95: What economists sometimes call the "long-run aggregate![]()
![]()
Unlock this Answer For Free Now!
View this answer and more for free by performing one of the following actions

Scan the QR code to install the App and get 2 free unlocks

Unlock quizzes for free by uploading documents