The table below shows total output for an economy over 2 years.
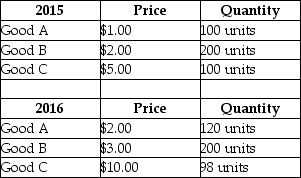 TABLE 20-5
-Refer to Table 20-5.The real GDP in 2016,expressed in 2015 prices,was
A) $700.
B) $840.
C) $970.
D) $1010.
E) $1740.
Correct Answer:
Verified
Q91: The table below shows the total output
Q92: The table below shows total output for
Q93: The table below shows total output for
Q94: The table below shows total output for
Q95: Suppose that nominal national income in some
Q97: The table below shows total output for
Q98: The table below shows total output for
Q99: The table below shows total output for
Q100: The table below shows the total output
Q110: Why are illegal activities,unreported activities,and non-market activities
Unlock this Answer For Free Now!
View this answer and more for free by performing one of the following actions

Scan the QR code to install the App and get 2 free unlocks

Unlock quizzes for free by uploading documents