The diagram below shows supply and demand diagrams (S and D) for some product.The government then imposes an excise tax.The new supply curve is  .
. 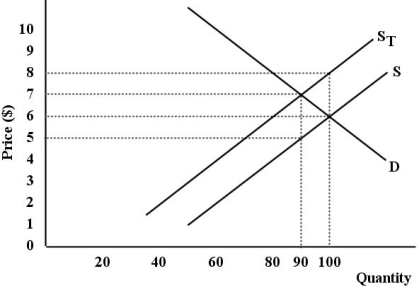 FIGURE 18-4
-Refer to Figure 18-4.What is the producers' net revenue after the imposition of the tax?
A) $450
B) $500
C) $540
D) $600
E) $630
Correct Answer:
Verified
Q63: The diagram below shows supply and demand
Q64: Q65: Suppose there is only one movie theatre Q66: Q67: Since corporate income taxes are levied on Q69: A Laffer curve Q70: Consider a monopolist that is earning profits Q71: Possible implications of corporate income taxes being Unlock this Answer For Free Now! View this answer and more for free by performing one of the following actions Scan the QR code to install the App and get 2 free unlocks Unlock quizzes for free by uploading documents![]()
![]()
A)relates the marginal tax rate

