The diagram below shows supply and demand diagrams (S and D) for some product.The government then imposes an excise tax.The new supply curve is  .
. 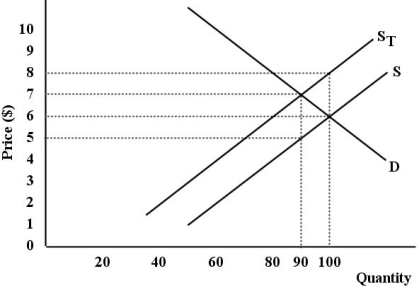 FIGURE 18-4
-Refer to Figure 18-4.What is the value of the tax imposed on this product,in dollars per unit?
A) $1
B) $2
C) $3
D) $4
E) $5
Correct Answer:
Verified
Q57: The two main competing goals in the
Q58: Consider two families,each of whom earn total
Q59: The figure below show a simplified version
Q60: An important objective in designing a tax
Q61: Which of the following best describes the
Q63: The diagram below shows supply and demand
Unlock this Answer For Free Now!
View this answer and more for free by performing one of the following actions

Scan the QR code to install the App and get 2 free unlocks

Unlock quizzes for free by uploading documents