The diagram below shows the marginal cost of abatement for each of two firms,A and B.Each firm is initially abating Q 0 units of pollution.
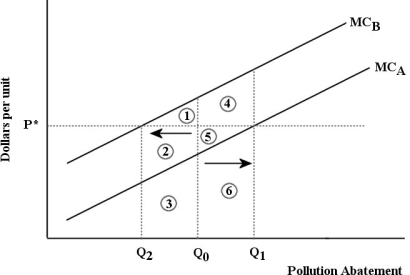 FIGURE 17-7
-Refer to Figure 17-7.Suppose that a system of tradable pollution permits is introduced into this market and the equilibrium permit price is p∗.Firm A will sell permits to Firm B because
A) Firm Aʹs total cost of abating more pollution (areas 5 + 6) is less than the revenue it earns from selling the permits (areas 4 + 5 + 6) .
B) Firm B has lower costs of pollution abatement than Firm A.
C) Firm A can buy the permits at a lower price than Firm B.
D) the revenue Firm A earns from selling permits (areas 5 + 6) is greater than the cost it incurs from abating more pollution (area 6) .
E) Firm Aʹs total cost of abating more pollution (area 6) is less than the revenue it earns from selling the permits (area 4 + 5) .
Correct Answer:
Verified
Q101: Consider a coal-fired electric-power plant that is
Q104: The diagram below shows a market for
Q105: In 2006,Professor Nicolas Stern of the United
Q107: The diagram below shows a market for
Q110: The diagram below shows a market for
Unlock this Answer For Free Now!
View this answer and more for free by performing one of the following actions

Scan the QR code to install the App and get 2 free unlocks

Unlock quizzes for free by uploading documents