The diagram below shows demand and supply curves for some perfectly competitive market.
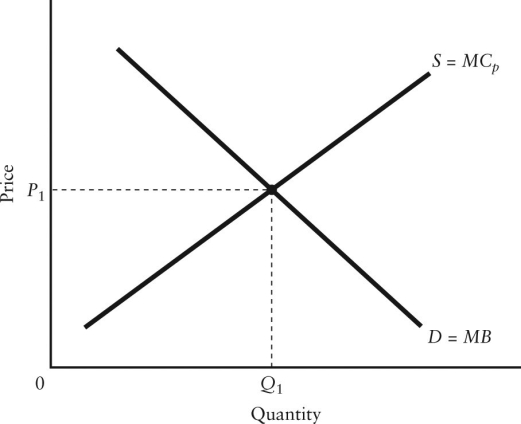 FIGURE 16-2
-Refer to Figure 16-2.Suppose that the marginal benefit curve (MB) includes all social benefits and that there is a negative externality in production.In this case, ________ for allocative efficiency.
A) P1 and Q1 are appropriate
B) the price P1 is appropriate but the quantity Q1 is too low
C) the price P1 is appropriate but the quantity Q1 is too high
D) the price P1 is too low and the quantity Q1 is too high
E) the price P1 is too high and the quantity Q1 is too low
Correct Answer:
Verified
Q23: The problem with externalities is essentially one
Q26: The diagram below shows demand and supply
Q28: If a firm produces a good and
Q30: The diagram below shows demand and supply
Q30: Government intervention in a particular industry is
Q33: Government intervention in an effort to promote
Q37: Consider an industry producing good X.The quantity
Q39: Which of the following phenomena is NOT
Q46: The diagram below shows the supply and
Q50: If a homeowner uses wood to heat
Unlock this Answer For Free Now!
View this answer and more for free by performing one of the following actions

Scan the QR code to install the App and get 2 free unlocks

Unlock quizzes for free by uploading documents