The diagram below shows the supply and demand for labour in a hypothetical town in northern British Columbia, with only one employer, a logging company.
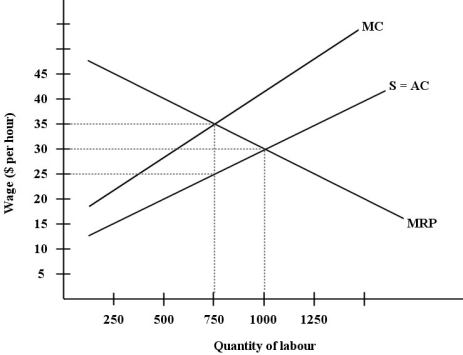 FIGURE 14-4
-Suppose there is a competitive market for retail workers at a large shopping mall that is large enough to constitute its own labour market. The labour demand curve is QD = 1000 - 20w) . The labour supply curve is QS = 400 + 40w) . Suppose that a union now successfully organizes the workers at this mall and obtains a wage rate of $11 but does not affect the demand curve) . The number of workers who wish to work at the new wage is
A) 400.
B) 440.
C) 780.
D) 840.
E) 1000.
Correct Answer:
Verified
Q62: A legislated minimum wage is comparable to
A)bilateral
Q64: The diagram below shows the supply and
Q65: If a minimum wage is set above
Q67: Q67: The diagram below shows the supply and Q69: Suppose there is a competitive market for Q71: Suppose there is a competitive market for![]()
Unlock this Answer For Free Now!
View this answer and more for free by performing one of the following actions

Scan the QR code to install the App and get 2 free unlocks

Unlock quizzes for free by uploading documents