The three diagrams below show the supply and demand for teenage babysitters in one local area. The initial supply curve is S 0 in all cases.
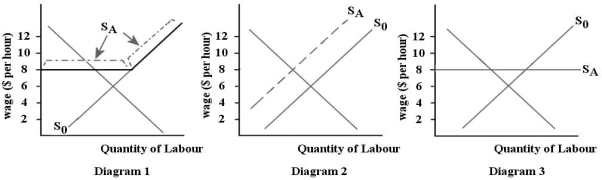 FIGURE 14-3
-Refer to Figure 14-3. Suppose the teenage babysitters in one local area are earning an equilibrium wage of $6 per hour. Now suppose the local government reduces the minimum age for working as a babysitter from 14 to 12 years of age. Which diagram illustrates the new supply curve SA) for babysitters?
A) diagram 1
B) diagram 2
C) diagram 3
D) none of the diagrams
E) any of the diagrams
Correct Answer:
Verified
Q82: The purpose of a labour union is
Q87: Unions currently represent _ government employees in
Q88: Canadian studies on the effects of minimum-wage
Q93: The average union wage premium in Canada
Q94: Which of the following statements about minimum-wage
Unlock this Answer For Free Now!
View this answer and more for free by performing one of the following actions

Scan the QR code to install the App and get 2 free unlocks

Unlock quizzes for free by uploading documents