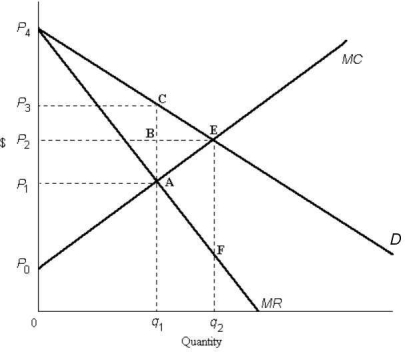
 FIGURE 12-3
-Refer to Figure 12-3. If the diagram is depicting a perfectly competitive industry, the equilibrium price and quantity is
A) P1 and q1.
B) P1 and q2.
C) P2 and q1.
D) P2 and q2.
E) P3 and q1.
Correct Answer:
Verified
Q22: Consider the efficiency of various market structures.In
Q25: The production possibilities boundary shows possible combinations
Q30: Consider the efficiency of various market structures
Q31: If a perfectly competitive industry was suddenly
Q35: The production possibilities boundary shows possible combinations
Q35: The production possibilities boundary shows possible combinations
Q37: In the absence of other market failures,allocative
Q40: Consider three firms,A,B and C,all producing kilos
Unlock this Answer For Free Now!
View this answer and more for free by performing one of the following actions

Scan the QR code to install the App and get 2 free unlocks

Unlock quizzes for free by uploading documents