 FIGURE 12-3
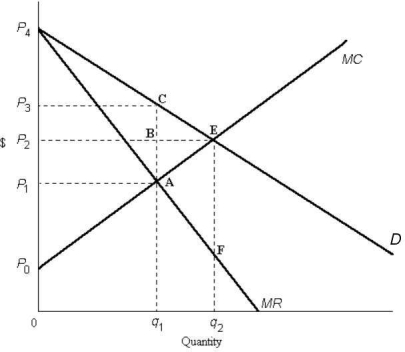
-Refer to Figure 12-3. The area representing consumer surplus in a monopoly equilibrium is outlined by
A) ACE.
B) ABE.
C) 0P4Eq2.
D) P3P4C.
E) P2P4E.
Correct Answer:
Verified
Q22: Consider the efficiency of various market structures.In
Q30: Consider the efficiency of various market structures
Q35: The production possibilities boundary shows possible combinations
Q37: Q40: Consider three firms,A,B and C,all producing kilos Q44: Which of the following is the result Q51: The diagram below shows supply,demand,and quantity exchanged Q54: In general,the sum of consumer and producer Q55: The diagram below shows supply,demand,and quantity exchanged Q57: The diagram below shows supply,demand,and quantity exchanged![]()
Unlock this Answer For Free Now!
View this answer and more for free by performing one of the following actions

Scan the QR code to install the App and get 2 free unlocks

Unlock quizzes for free by uploading documents