Multiple Choice
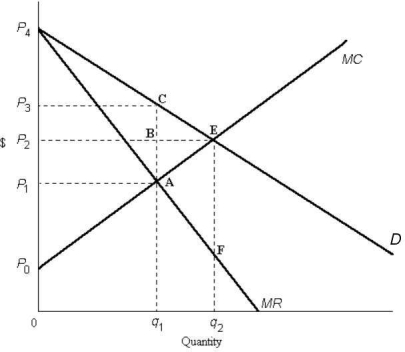 FIGURE 12-3
-Refer to Figure 12-3. The area representing producer surplus at the monopoly equilibrium is outlined by
A) 0P0Aq1.
B) P0P2BA.
C) P0AP1.
D) P0P3CA.
E) 0P3Cq1.
Correct Answer:
Verified
Related Questions
Q49: The diagram below shows supply,demand,and quantity exchanged
Q52: Suppose we compare two monopolists with identical
Q53: Allocative efficiency occurs when
A)producer surplus is maximized.
B)consumer
Unlock this Answer For Free Now!
View this answer and more for free by performing one of the following actions

Scan the QR code to install the App and get 2 free unlocks

Unlock quizzes for free by uploading documents