 FIGURE 12-3
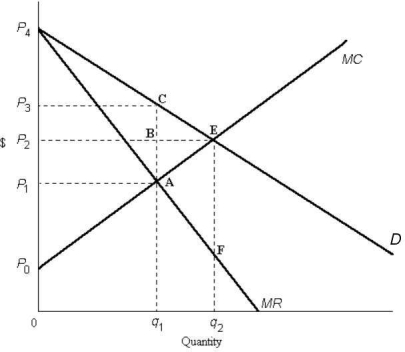
-Refer to Figure 12-3. Comparing the monopoly equilibrium to the perfectly competitive equilibrium, the area representing the gain in producer surplus due to monopoly is outlined by
A) P1P3CA less ACE.
B) P2P3CB less ABE.
C) P0P3CA less ACE
D) P3P4 less ABE.
E) P2P4E.
Correct Answer:
Verified
Q42: When comparing a monopoly equilibrium to a
Q48: Q48: The diagram below shows supply,demand,and quantity exchanged Q51: The diagram below shows supply,demand,and quantity exchanged Q51: Q55: The diagram below shows supply,demand,and quantity exchanged Q56: The deadweight loss of monopoly is Q57: The diagram below shows supply,demand,and quantity exchanged Q59: The diagram below shows supply,demand,and quantity exchanged Q60: The diagram below shows supply,demand,and quantity exchanged![]()
![]()
A)its fixed
Unlock this Answer For Free Now!
View this answer and more for free by performing one of the following actions

Scan the QR code to install the App and get 2 free unlocks

Unlock quizzes for free by uploading documents