The diagram below shows the short-run cost curves for 3 perfectly competitive firms in the same industry. 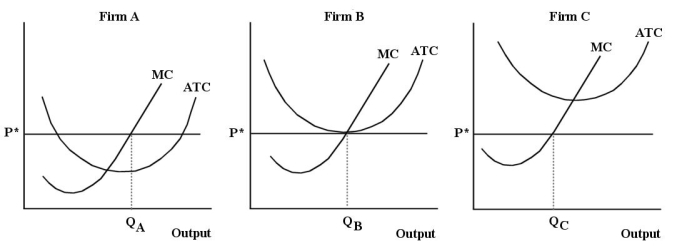 FIGURE 9-6
-Refer to Figure 9-6.Given that Firms A,B and C are in the same industry,is this industry in long-run equilibrium?
A) No,because Firm A is not producing at a profit-maximizing level of output.
B) No,because if the industry were in equilibrium,all 3 firms would be earning zero economic profits.
C) Yes,because all 3 firms are producing at their minimum average total cost.
D) Yes,because P = MC = MR for each of the 3 firms.
E) Yes,because each of the 3 firms is operating at its minimum efficient scale.
Correct Answer:
Verified
Q137: Consider the following cost curves for Firm
Q138: If a competitive firm is producing to
Q139: Suppose a typical firm in a competitive
Q140: If firms in a competitive industry are
Q141: Comparing the short-run and long-run profit-maximizing positions
Q143: Consider the textile industry,which we assume to
Q144: Suppose a paper mill in Quebec is
Q145: Which of the following conditions is true
Q146: Suppose a perfectly competitive industry is in
Q147: The diagram below shows the short-run cost
Unlock this Answer For Free Now!
View this answer and more for free by performing one of the following actions

Scan the QR code to install the App and get 2 free unlocks

Unlock quizzes for free by uploading documents