Multiple Choice
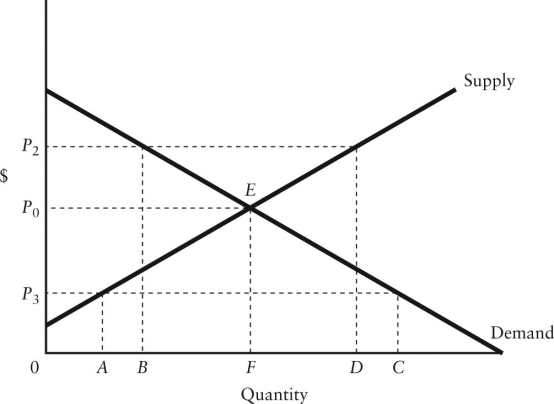
 FIGURE 5-1
-Refer to Figure 5-1. If the diagram applies to the labour market, and P3 represents a legislated minimum wage,
A) there will be excess demand of AC in the labour market.
B) there will be unemployment of AC in the labour market.
C) the free-market equilibrium wage is P0 and the labour market is unaffected by the minimum wage.
D) the labour market is in disequilibrium.
E) the amount of labour employed will rise from quantity F to quantity C.
Correct Answer:
Verified
Related Questions
Q41: Q44: The shortages associated with a binding price Q46: If the equilibrium price for some product![]()

