Multiple Choice
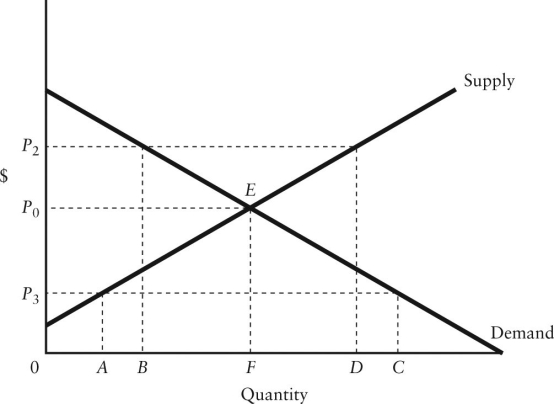 FIGURE 5-1
-Refer to Figure 5-1. If the diagram applies to the market for rental housing and P3 represents the maximum rent that can be charged, then
A) there will be an excess supply of rental units equal to BD.
B) units supplied will be reduced relative to the competitive equilibrium by AF rental units.
C) windfall profits will be earned by landlords.
D) there will be excess demand for rental units equal to FC.
E) there will be excess demand for rental units equal to AF.
Correct Answer:
Verified
Related Questions

