 FIGURE 5-6
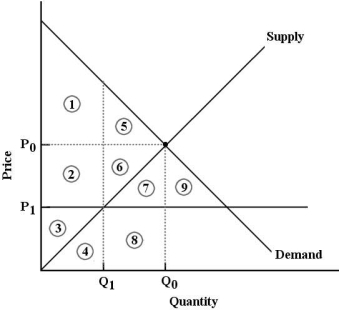
-Refer to Figure 5-6. The market for good X is in equilibrium at P 0 and Q0. Now suppose the government imposes a at P1. One result would be .
A) price ceiling; an increase in economic surplus represented by areas 5 and 6
B) price ceiling; a deadweight loss represented by areas 5, 6, 7 and 8
C) price floor; a deadweight loss represented by areas 5, 6, 7 and 8
D) price floor; a deadweight loss represented by areas 2, 6 and 7
E) price ceiling; a deadweight loss represented by areas 5 and 6
Correct Answer:
Verified
Q69: The diagram below shows the market for
Q72: The diagram below shows the market for
Q103: Q103: Consider the following demand and supply schedules Q105: Consider the following demand and supply schedules Q110: Q111: Consider the Canadian market for barley.Suppose a Q116: Consider the following demand and supply schedules Q118: Q120: Unlock this Answer For Free Now! View this answer and more for free by performing one of the following actions Scan the QR code to install the App and get 2 free unlocks Unlock quizzes for free by uploading documents![]()
![]()
![]()
![]()

