Multiple Choice
Figure 2-5 shows monthly average (per unit) production costs for producing Good X. 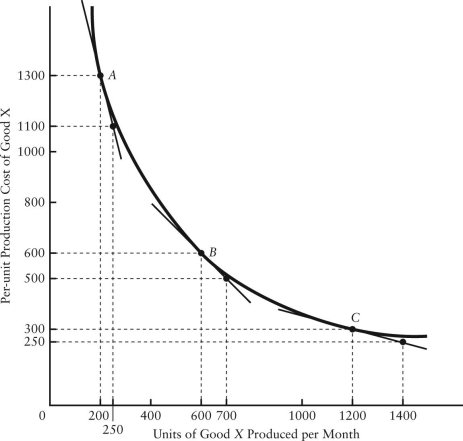 FIGURE 2-5
-Refer to Figure 2-5.What is the slope of this non-linear function when 600 units per month are being produced?
A) -2
B) 4
C) -4
D) 1
E) -1
Correct Answer:
Verified
Related Questions

