Use the figure below to answer the following questions.
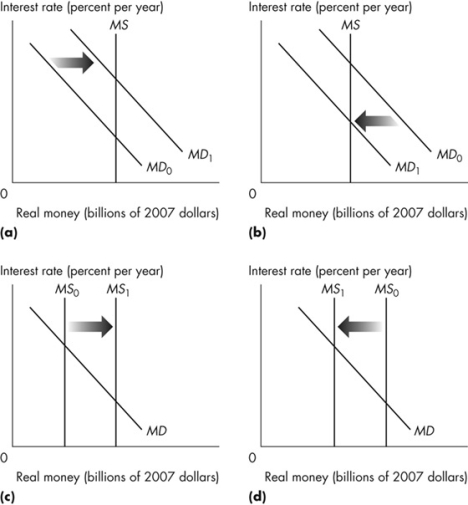 Figure 8.5.1
-Refer to Figure 8.5.1.Everything else remaining the same, which graph best shows the effect of a decrease in real GDP?
A) a
B) b
C) c
D) d
E) a and c
Correct Answer:
Verified
Q83: Everything else remaining the same, an increase
Q84: The amount of real money people want
Q85: Real money is equal to
A)nominal money divided
Q86: Nominal money is equal to real
A)GDP times
Q87: Use the figure below to answer the
Q89: The opportunity cost of holding money increases
Q90: The opportunity cost of holding currency is
A)consumption
Q91: Which one of the following will shift
Q92: Choose the correct statement.
A)The quantity of money
Q93: If households and firms find they are
Unlock this Answer For Free Now!
View this answer and more for free by performing one of the following actions

Scan the QR code to install the App and get 2 free unlocks

Unlock quizzes for free by uploading documents