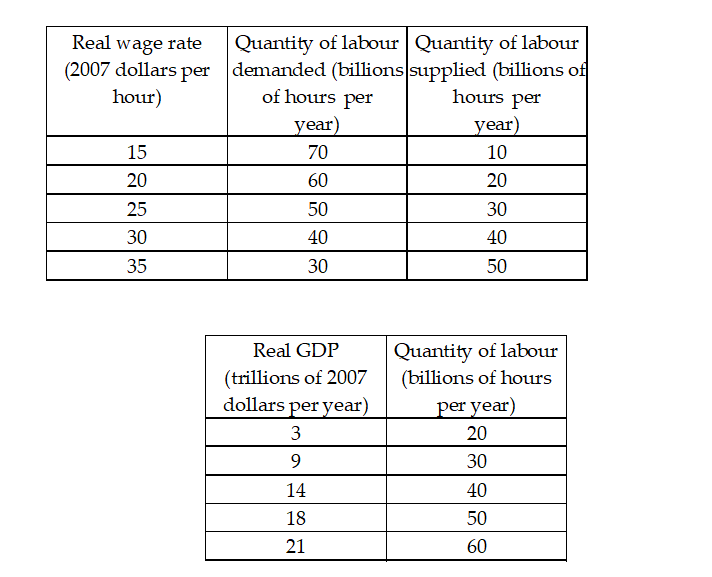
Refer to Table 6.3.1.The top table describes an economy's labour market.The second table describes its production function.Potential GDP is
A) $14 trillion.B) $40 trillion.C) $25 trillion.D) $6 trillion.E) $9 trillion.Answer: A
-Refer to Table 6.3.1.The top table describes an economy's labour market.The second table describes its production function.An increase in population changes the quantity of labour supplied by 20 billion hours at each real wage rate.Potential GDP
A) does not change.
B) changes to $20 trillion.
C) changes to $50 trillion.
D) changes to $3 trillion.
E) changes to $18 trillion.
Correct Answer:
Verified
Q38: If the real wage rate is $10.00
Q39: Of the following countries, which has the
Q40: Between 1926 and 2016, the average growth
Q41: When labour productivity decreases, the
A)supply of labour
Q42: When the population increases, potential GDP _
Q44: Use the figure below to answer the
Q45: A movement along the aggregate production function
Q46: When labour productivity decreases, there is _
Q47: The aggregate production function shows how _changes
Q48: If an increase in capital increases labour
Unlock this Answer For Free Now!
View this answer and more for free by performing one of the following actions

Scan the QR code to install the App and get 2 free unlocks

Unlock quizzes for free by uploading documents