Use the figure below to answer the following question.
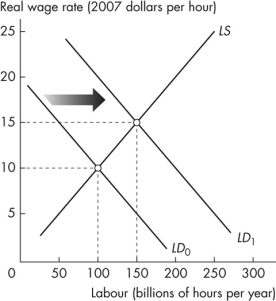 Figure 6.3.3
-Refer to Figure 6.3.3.The graph shows the effect of _______ As a result _______.
A) an increase in the population; potential GDP increases and potential GDP per hour of labour decreases
B) a decrease in the population; potential GDP decreases and potential GDP per hour of labour increases
C) an increase in labour productivity; potential GDP increases and potential GDP per hour of labour does not change
D) an increase in labour productivity; potential GDP increases and potential GDP per hour of labour decreases
E) an increase in labour productivity; potential GDP and potential GDP per hour of labour increase
Correct Answer:
Verified
Q48: If an increase in capital increases labour
Q49: Ceteris paribus, an increase in labour productivity
Q50: If real GDP is $12,150 billion and
Q51: When the population increases with no change
Q52: An increase in labour productivity _ the
Q54: Use the figure below to answer the
Q55: Labour productivity is
A)shown as a movement along
Q56: When labour productivity increases, the demand for
Q57: An increase in population
A)creates a movement along
Q58: Ceteris paribus, an increase in the population
Unlock this Answer For Free Now!
View this answer and more for free by performing one of the following actions

Scan the QR code to install the App and get 2 free unlocks

Unlock quizzes for free by uploading documents