Use the figure below to answer the following questions.
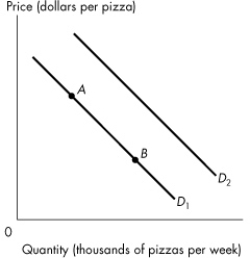 Figure 3.2.2
-Refer to Figure 3.2.2.If consumers' income increases,
A) the demand curve for pizzas shifts from D1 to D2 if a pizza is a normal good.
B) a movement from point A to point B on D1 occurs.
C) the quantity of pizzas demanded increases.
D) the quantity of pizzas supplied decreases.
E) the supply of pizzas increases.
Correct Answer:
Verified
Q18: Which market is an example of a
Q19: Use the table below to answer the
Q20: The money price of a litre of
Q21: An increase in the price of ground
Q22: Good A is a normal good if
A)good
Q24: The price of good X falls and
Q25: Which one of the following would lead
Q26: A decrease in quantity demanded is represented
Q27: Some sales managers are talking shop.Which one
Q28: A turnip is an inferior good if
A)an
Unlock this Answer For Free Now!
View this answer and more for free by performing one of the following actions

Scan the QR code to install the App and get 2 free unlocks

Unlock quizzes for free by uploading documents