Use the figure below to answer the following questions.
Table 3.5.2 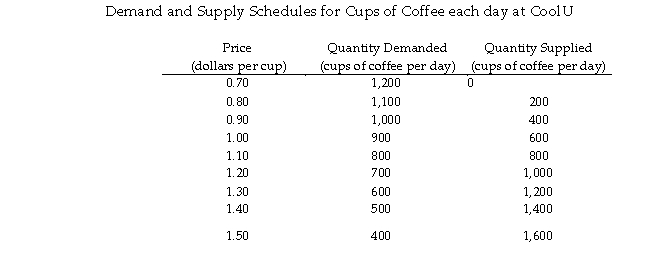
-Refer to Table 3.5.2.Professor Hyper publishes a new study, showing that coffee raises the test performance of students.Students double their demand for coffee.This change would be represented as a
A) leftward shift of the supply curve.
B) movement up along the demand curve.
C) rightward shift of the supply curve.
D) leftward shift of the demand curve.
E) rightward shift of the demand curve.
Correct Answer:
Verified
Q137: Which of the following events leads to
Q139: When the price of good A rises,
Q140: Use the information below to answer the
Q141: Use the figure below to answer the
Q143: Use the table below to answer the
Q144: Use the table below to answer the
Q144: Use the figure below to answer the
Q145: Use the figure below to answer the
Q145: Use the table below to answer the
Q158: Use the figure below to answer the
Unlock this Answer For Free Now!
View this answer and more for free by performing one of the following actions

Scan the QR code to install the App and get 2 free unlocks

Unlock quizzes for free by uploading documents