Use the figure below to answer the following question.
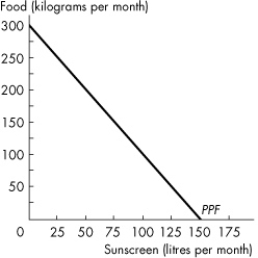 Figure 2.1.5
-The graph in Figure 2.1.5 shows Sunland's PPF for food and sunscreen.Sunland faces _______ opportunity cost of food and _______ opportunity of sunscreen.
A) a decreasing; a decreasing
B) a constant; a constant
C) an increasing; an increasing
D) a decreasing; an increasing
E) an increasing; a decreasing
Correct Answer:
Verified
Q36: Use the figure below to answer the
Q37: Use the figure below to answer the
Q38: Use the figure below to answer the
Q39: The existence of increasing opportunity cost
A)explains why
Q40: As we increase production of X, we
Q42: Use the table below to answer the
Q43: Use the figure below to answer the
Q44: The production possibilities frontier is
A)downward sloping and
Q45: Use the table below to answer the
Q46: Use the table below to answer the
Unlock this Answer For Free Now!
View this answer and more for free by performing one of the following actions

Scan the QR code to install the App and get 2 free unlocks

Unlock quizzes for free by uploading documents