Use the figure below to answer the following question.
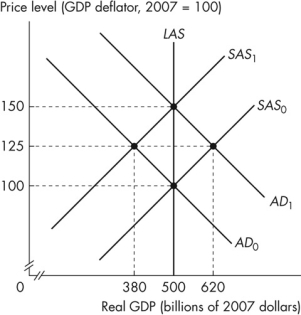 Figure 12.2.1
-Refer to Figure 12.2.1.The figure illustrates an economy initially in equilibrium at the intersection of the SAS0 curve and the AD0 curve.Which of the following shifts the short- run aggregate supply curve from SAS0 to SAS1?
A) an increase in the demand for money
B) a decrease in the money wage rate
C) an increase in the marginal product of labour
D) an increase in the price level
E) an increase in the price of oil
Correct Answer:
Verified
Q53: Use the figure below to answer the
Q54: Use the figure below to answer the
Q55: Use the figure below to answer the
Q56: A forecast based on all the relevant
Q57: Use the figure below to answer the
Q59: Use the figure below to answer the
Q60: An increase in the price level due
Q61: A correctly anticipated increase in the quantity
Q62: The short- run Phillips curve shows the
Q63: A forecast that is based on all
Unlock this Answer For Free Now!
View this answer and more for free by performing one of the following actions

Scan the QR code to install the App and get 2 free unlocks

Unlock quizzes for free by uploading documents