Use the figure below to answer the following question.
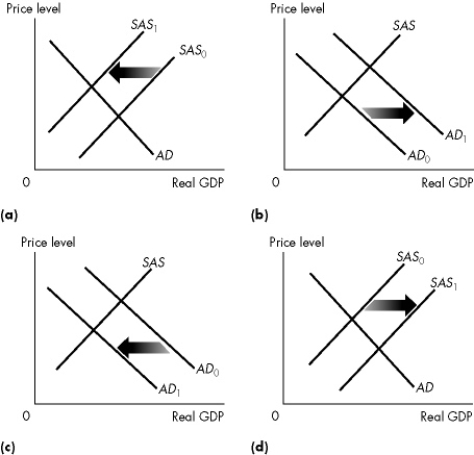 Figure 12.2.5
-Refer to Figure 12.2.5.Which one of the graphs in the figure represents an economy experiencing stagflation?
A) a only
B) b only
C) c only
D) d only
E) Both a and c
Correct Answer:
Verified
Q73: Use the figure below to answer the
Q74: Choose the statement that is incorrect.
A)A one-
Q75: Deflation occurs when
A)the growth rate of potential
Q76: Deflation is
A)a persistent and ongoing falling price
Q77: When the price level is rising and,
Q79: Along the short- run Phillips curve, everything
Q80: Choose the statement that is incorrect.
A)The price
Q81: Use the figure below to answer the
Q82: An increase in the expected rate of
Q83: Use the table below to answer the
Unlock this Answer For Free Now!
View this answer and more for free by performing one of the following actions

Scan the QR code to install the App and get 2 free unlocks

Unlock quizzes for free by uploading documents