Use the figure below to answer the following questions.
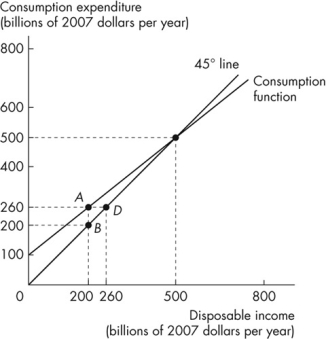 Figure 11.1.1
This figure describes the relationship between consumption expenditure and disposable income for an economy.
-Refer to Figure 11.1.1.When disposable income is $500 billion, saving is equal to
A) $20 billion.
B) consumption expenditure.
C) zero.
D) $40 billion.
E) disposable income.
Correct Answer:
Verified
Q8: If the marginal propensity to consume is
Q9: The marginal propensity to consume is calculated
Q10: The marginal propensity to consume is the
A)fraction
Q11: A household
A)consumes, saves, or pays taxes out
Q12: If a household's disposable income increases from
Q14: If the marginal propensity to save is
Q15: The marginal propensity to save
A)is greater than
Q16: If consumption is $8,000 when disposable income
Q17: The marginal propensity to consume
A)is greater than
Q18: Use the figure below to answer the
Unlock this Answer For Free Now!
View this answer and more for free by performing one of the following actions

Scan the QR code to install the App and get 2 free unlocks

Unlock quizzes for free by uploading documents