Use the figure below to answer the following questions.
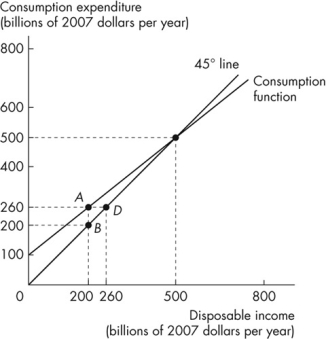 Figure 11.1.1
This figure describes the relationship between consumption expenditure and disposable income for an economy.
-Refer to Figure 11.1.1.The marginal propensity to consume for this economy is
A) 0.5.
B) 0.2.
C) 0.8.
D) 1.
E) 0.6.
Correct Answer:
Verified
Q1: When the consumption function lies below the
Q3: Use the figure below to answer the
Q4: Dissaving occurs when a household
A)consumes more than
Q5: The marginal propensity to save is calculated
Q6: Disposable income is
A)used for consumption only.
B)aggregate income
Q7: Use the figure below to answer the
Q8: If the marginal propensity to consume is
Q9: The marginal propensity to consume is calculated
Q10: The marginal propensity to consume is the
A)fraction
Q11: A household
A)consumes, saves, or pays taxes out
Unlock this Answer For Free Now!
View this answer and more for free by performing one of the following actions

Scan the QR code to install the App and get 2 free unlocks

Unlock quizzes for free by uploading documents