Use the figure below to answer the following questions.
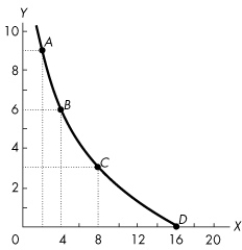 Figure 1A.3.4
-Figure 1A.3.4 illustrates two variables, x and y, which are
A) negatively related, with slope becoming closer to 0 as x increases from 2 to 16.
B) positively related, with the slope unchanging as x increases from 2 to 16.
C) negatively related, with slope becoming farther from 0 as x increases from 2 to 16.
D) positively related, with slope becoming closer to 0 as x increases from 2 to 16.
E) positively related, with slope becoming farther from 0 as x increases from 2 to 16.
Correct Answer:
Verified
Q130: Consider graph (b)of Figure 1A.2.1.Which one of
Q135: Use the figure below to answer the
Q137: Use the figure below to answer the
Q138: Use the figure below to answer the
Q140: The relationship between two variables that move
Q142: Use the figure below to answer the
Unlock this Answer For Free Now!
View this answer and more for free by performing one of the following actions

Scan the QR code to install the App and get 2 free unlocks

Unlock quizzes for free by uploading documents