Use the table below to answer the following questions.
Table 1A.4.2
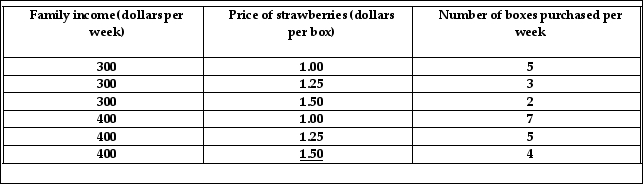

-Given the data in Table 1A.4.2, holding income constant, the graph relating the price of strawberries, measured on the y- axis and the purchases of strawberries, measured on the x- axis
A) is a positively sloped line.
B) is a vertical line.
C) is a negatively sloped line.
D) is a horizontal line.
E) reaches a minimum.
Correct Answer:
Verified
Q147: To graph a relationship among three variables
Q148: Use the figure below to answer the
Q149: Consider the following information on cola sales
Q150: Use the figure below to answer the
Unlock this Answer For Free Now!
View this answer and more for free by performing one of the following actions

Scan the QR code to install the App and get 2 free unlocks

Unlock quizzes for free by uploading documents