The diagram below shows the domestic demand and supply curves in the market for newsprint in Paperland.
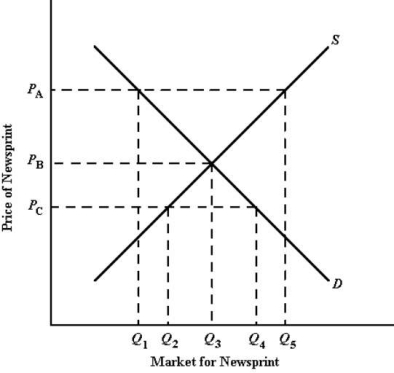 FIGURE 33- 5
-Refer to Figure 33- 5. If Paperland engages in international trade and the world price is PA, the amount of newsprint will be .
A) imported; Q1
B) imported; Q5 - Q3
C) exported; Q5 - Q1
D) imported; Q5 - Q1
E) exported; Q5
Correct Answer:
Verified
Q1: Canada is a net exporter of oil.
Q2: If Country A has a comparative advantage
Q3: If a country has a comparative advantage
Q5: The diagram below shows Robinson Crusoe's annual
Q6: Economies of scale and product differentiation can
Q7: The diagram below shows the domestic demand
Q8: The diagram below shows the (hypothetical)demand and
Q9: Two nations want to engage in trade
Q10: In moving from a no- trade to
Q11: The diagram below shows Robinson Crusoe's annual
Unlock this Answer For Free Now!
View this answer and more for free by performing one of the following actions

Scan the QR code to install the App and get 2 free unlocks

Unlock quizzes for free by uploading documents