The diagram below shows the domestic demand and supply curves in the market for newsprint in Paperland.
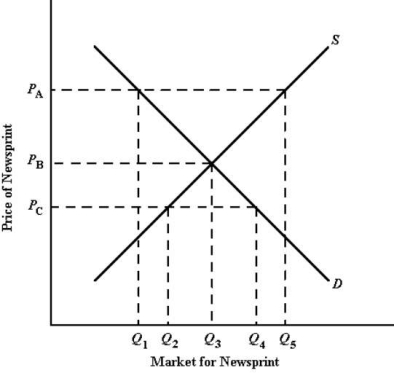 FIGURE 33- 5
-Refer to Figure 33- 5. If Paperland engages in trade and the world price is PB, the residents of Paperland will consume units of newsprint, and the net exports of newsprint from Paperland will be units.
A) Q1; Q5 - Q1
B) Q2; zero
C) Q3; zero
D) Q4; Q5 - Q1
E) Q5; zero
Correct Answer:
Verified
Q28: Canadians consume millions of cups of Tim
Q29: When specialization according to comparative advantage also
Q30: The division of the gains of trade
Q31: A country with a domestic market is
Q33: The diagram below shows the (hypothetical)demand and
Q34: The diagram below shows the domestic demand
Q35: When two countries are specializing and trading
Q36: The diagram below shows the domestic demand
Q37: According to what economists call the "law
Q113: If Canada's index of import prices is
Unlock this Answer For Free Now!
View this answer and more for free by performing one of the following actions

Scan the QR code to install the App and get 2 free unlocks

Unlock quizzes for free by uploading documents