The diagram below shows Robinson Crusoe's annual production possibilities boundary for the production of bananas and coconuts. 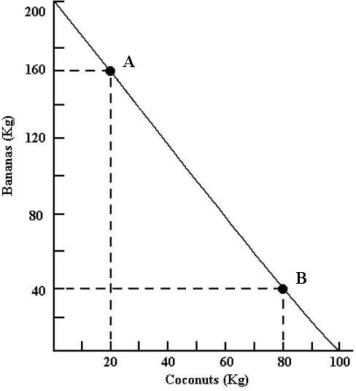 FIGURE 33- 3
-Refer to Figure 33- 3. Starting from point B and moving to point A, his opportunity cost of producing each additional kilogram of bananas is
A) increasing.
B) decreasing followed by increasing.
C) constant.
D) decreasing.
E) increasing followed by decreasing.
Correct Answer:
Verified
Q60: The concept of "comparative advantage" refers to
Q61: The diagram below shows Robinson Crusoe's annual
Q62: Suppose that Spain is currently producing 90
Q63: If two countries each produce wool and
Q64: If two nations want to trade with
Q66: Suppose Canada could produce all goods and
Q67: opportunity costs are the same in the
Q68: The diagram below shows Robinson Crusoe's annual
Q69: The existence of "absolute advantage"
A)fosters the self-
Q70: If two countries each produce wool and
Unlock this Answer For Free Now!
View this answer and more for free by performing one of the following actions

Scan the QR code to install the App and get 2 free unlocks

Unlock quizzes for free by uploading documents