The diagram below shows the budget deficit function for a hypothetical economy.
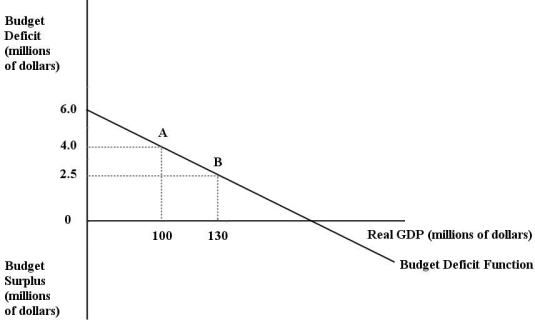 FIGURE 32- 1
-Refer to Figure 32- 1. Initially, suppose that real GDP is $100 million and the budget deficit is $4 million, as shown by point A on the graph. Which of the following is consistent with a move from point A to point B?
A) the economy entering into a boom
B) implementation of an expansionary fiscal policy
C) implementation of a contractionary fiscal policy
D) the economy entering into a recession
E) implementation of a contractionary monetary policy
Correct Answer:
Verified
Q53: If the government were able to operate
Q54: Suppose that the real rate of interest
Q55: Consider the budget deficit function, graphed with
Q56: In an open economy with internationally mobile
Q57: With an unchanged fiscal policy by government,
Q59: Suppose the stock of government debt in
Q60: Consider a government with an outstanding stock
Q61: If the economy goes into a recession,
Q62: Consider the following data about government debt
Q63: In the long run, the government budget
Unlock this Answer For Free Now!
View this answer and more for free by performing one of the following actions

Scan the QR code to install the App and get 2 free unlocks

Unlock quizzes for free by uploading documents