The table below shows real GDP, potential GDP and the unemployment rate for a hypothetical economy. 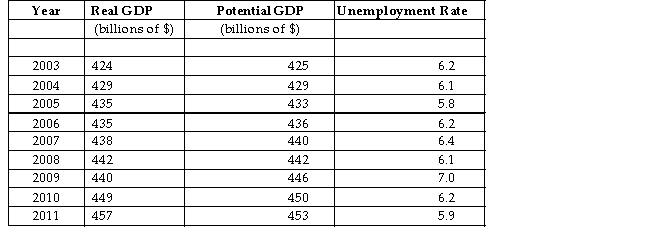 TABLE 31- 1
-Refer to Table 31- 1. The variations in the unemployment rate between 2003 and 2011 are due to variations in
A) potential output.
B) structural unemployment.
C) frictional unemployment.
D) the NAIRU.
E) the output gap.
Correct Answer:
Verified
Q1: When the growth rate of the labour
Q2: The total amount of unemployment in the
Q3: One motivation for having publicly subsidized retraining
Q4: Economic models in which the NAIRU can
Q6: According to 2008 data, unemployment rates for
Q7: Many economists believe that the more strict
Q8: New Classical theories of the labour market
Q9: The total amount of unemployment in the
Q10: The best description of the cause of
Q11: An unemployed worker can be identified as
Unlock this Answer For Free Now!
View this answer and more for free by performing one of the following actions

Scan the QR code to install the App and get 2 free unlocks

Unlock quizzes for free by uploading documents