The economy in the diagram below begins in long- run equilibrium at E0.
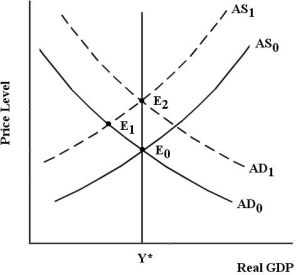 FIGURE 31- 2
-Refer to Figure 31- 2. At E0, the unemployment rate is 5.6 percent. An increase in the price of raw materials shifts the AS curve to AS1 and a new short- run equilibrium is established at E1. At E1, the unemployment rate is 7 percent. Therefore,
A) the economy is at full employment.
B) cyclical unemployment is negative.
C) the sum of frictional and structural unemployment is 7 percent.
D) the NAIRU is 7 percent.
E) cyclical unemployment is 1.4 percent.
Correct Answer:
Verified
Q21: The ongoing process of globalization of the
Q22: An unemployed worker can be identified as
Q23: Which of the following best explains why
Q24: Which of the following policies could the
Q25: Suppose there are 2000 unemployed textile workers
Q27: If there were an increase in the
Q28: A likely consequence of firms paying "efficiency
Q29: Suppose that next year 300 000 existing
Q30: New Classical theories suggest that fluctuations in
Q31: If labour markets had perfectly flexible wages,
Unlock this Answer For Free Now!
View this answer and more for free by performing one of the following actions

Scan the QR code to install the App and get 2 free unlocks

Unlock quizzes for free by uploading documents