The table below shows real GDP, potential GDP and the unemployment rate for a hypothetical economy. 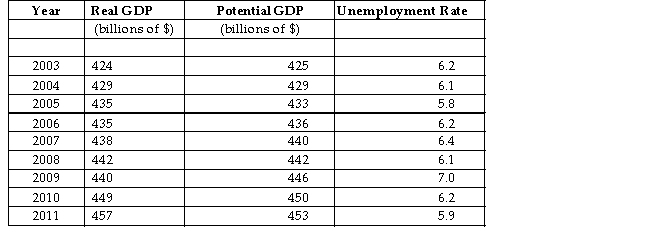 TABLE 31- 1
-Refer to Table 31- 1. In which years is this economy operating at full employment?
A) 2004 only
B) 2004 and 2008
C) 2005 only
D) 2006 only
E) 2005 and 2011
Correct Answer:
Verified
Q54: The labour market in the diagram below
Q55: The theory of "efficiency wages" suggests that
Q56: When aggregate output is greater than potential
Q57: Other things being equal, when changes in
Q58: The total amount of unemployment in the
Q60: If, as the New Classical theories suggest,
Q61: Which statement by an employer is consistent
Q62: If the actual unemployment rate is one
Q63: One reason that economists are interested in
Q64: Technological changes over time have caused workers
Unlock this Answer For Free Now!
View this answer and more for free by performing one of the following actions

Scan the QR code to install the App and get 2 free unlocks

Unlock quizzes for free by uploading documents