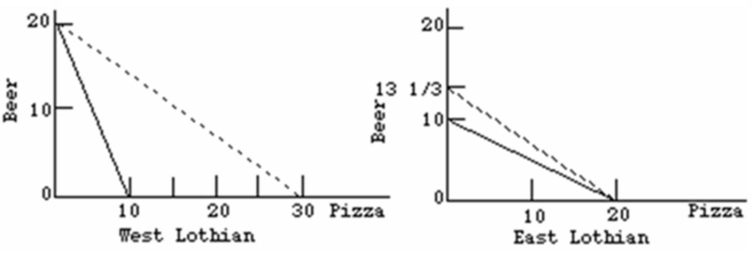
 Refer to the above diagrams.The solid lines are production possibilities curves; the dashed lines are trading possibilities curves.The data contained in the production possibilities curves are based on the assumption of:
A) imperfect substitutability of resources as between beer and pizza production.
B) constant costs.
C) decreasing costs.
D) increasing costs.
Correct Answer:
Verified
Q5: International trade based on the principle of
Q19: The World Trade Organization advocates new protections
Q20: Assume that by devoting all its resources
Q21: The best example of a capital-intensive good
Q22: The following is the Production possibilities tables
Q24: In a two-nation world, comparative advantage means
Unlock this Answer For Free Now!
View this answer and more for free by performing one of the following actions

Scan the QR code to install the App and get 2 free unlocks

Unlock quizzes for free by uploading documents