The graph below shows the production possibility curves for two hypothetical nations, Orin and Pohl, which each make two hypothetical products, jaxs and keps.Which of the following statements is correct? 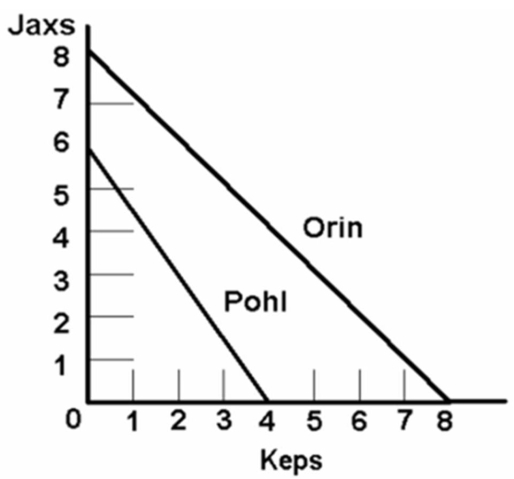
A) Orin has a comparative advantage in both jaxs and keps.
B) Pohl has a comparative advantage in jaxs.
C) The opportunity cost of making jaxs is lower in Orin than in Pohl.
D) Orin is more efficient than Pohl.
Correct Answer:
Verified
Q45: The impact of increasing, as opposed to
Q46: Q47: The following information is about the cost Q48: Assuming labour forces of equal size, the Q49: Given the following production possibilities schedules, it Q52: The data embodied in the below diagrams Q54: The following is the Production possibilities data Q55: The data given is for two hypothetical Q63: Assume that by devoting all of its Q81: If a nation has a comparative advantage![]()
Unlock this Answer For Free Now!
View this answer and more for free by performing one of the following actions

Scan the QR code to install the App and get 2 free unlocks

Unlock quizzes for free by uploading documents