Refer to the graphs below.The first graph shows the money market of an economy, and the second graph shows the market for goods and services in the economy. 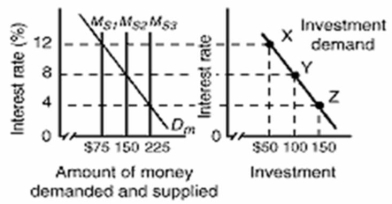
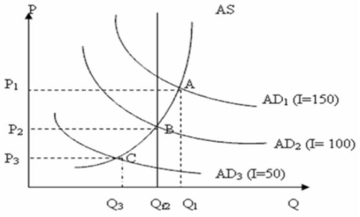 In the above diagrams, the numbers in the parentheses after the AD1, AD2, and AD3 labels indicate the levels of investment spending associated with each AD curve.All figures are in billions.Qf is the full-employment level of real output.The interest rate in the economy is 4 percent.Which of the following should the monetary authorities do to achieve a non-inflationary full-employment level of real GDP?
A) They should increase the money supply from $75 billion to $225 billion.
B) They should decrease the money supply by $150 billion.
C) They should decrease the money supply from $225 billion to $150 billion.
D) They should increase the money supply by $200 billion.
Correct Answer:
Verified
Q157: The Sale and Repurchase Agreement (SRA), is
Q158: To reduce the overnight lending rate, the
Q159: The bank rate is the rate of
Q160: If the chartered banking system borrows from
Q161: The so-called Taylor Rule states that:
A)monetary policy
Q163: According to the Taylor Rule:
A)for each 1
Q164: The price of government bonds and the
Q165: In implementing monetary policy with respect to
Q166: Which of the following best describes the
Q167: If the demand for money increases and
Unlock this Answer For Free Now!
View this answer and more for free by performing one of the following actions

Scan the QR code to install the App and get 2 free unlocks

Unlock quizzes for free by uploading documents