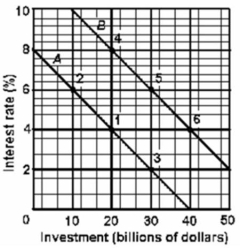
 Lines A and B in the above graph represent:
A) the crowding-out effect.
B) the interest-rate effect.
C) investment demand curves.
D) money demand curves.
Correct Answer:
Verified
Q196: Currently, the general agreement about a proposed
Q197: The Federal budget deficit is calculated each
Q198: The following budget information is for a
Q199: To understand the quantitative significance of the
Q200: During the last decade, the gross federal
Q202: The average tax rate required to service
Q203: The most likely way the public debt
Q204: The real burden of an increase in
Q205: Crowding out is a decrease in private
Q206: Which one of the following might offset
Unlock this Answer For Free Now!
View this answer and more for free by performing one of the following actions

Scan the QR code to install the App and get 2 free unlocks

Unlock quizzes for free by uploading documents