Refer to the diagram given below. 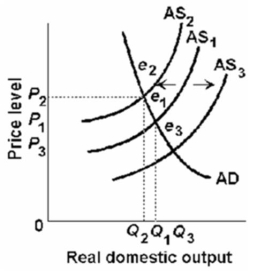 Cost-push inflation can be illustrated by a:
A) shift of the aggregate supply curve from AS1 to AS2.
B) shift of the aggregate supply curve from AS1 to AS3.
C) shift of the aggregate supply curve from AS2 to AS3.
D) movement along the aggregate demand curve from e1 to e3.
Correct Answer:
Verified
Q148: Cost-push inflation arises from:
A)a decrease in aggregate
Q149: Refer to the diagram given below.
Q150: Refer to the diagram given below.
Q151: Refer to the diagram given below.
Q152: The following aggregate demand and supply schedules
Q154: Refer to the diagram below. 
Q155: Cost-push inflation occurs because of a:
A)rightward shift
Q156: Collective bargaining agreements that prohibit wage cuts
Q157: Refer to the figure given below.
Q158: The following aggregate demand and supply schedules
Unlock this Answer For Free Now!
View this answer and more for free by performing one of the following actions

Scan the QR code to install the App and get 2 free unlocks

Unlock quizzes for free by uploading documents