Refer to the diagram below.A shift in the production possibilities curve from AB to CD is most likely due to: 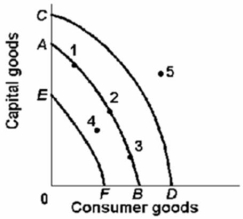
A) the use of the economy's resources in an efficient way.
B) an increase in the spending of business and consumers.
C) an increase in government purchase of the economy's output.
D) an increase in the quantity and quality of labour resources.
Correct Answer:
Verified
Q68: Real GDP in any year is equal
Q69: Q70: Which of the following would not be Q71: The historical reallocation of labour from agriculture Q73: Suppose total output (real GDP) is $4000 Q74: Suppose total output (real GDP) is $10,000 Q75: Which of the following is correct? Q76: Economic growth can best be portrayed as Q77: Economic growth can be portrayed as a(n): Q173: Assume that an economy has 1,500 workers,![]()
A)total output
A)outward
Unlock this Answer For Free Now!
View this answer and more for free by performing one of the following actions

Scan the QR code to install the App and get 2 free unlocks

Unlock quizzes for free by uploading documents