Refer to the diagrams below in which figures (a) and (b) show demand curves reflecting the prices Alvin and Elmer are willing to pay for a public good, rather than do without it.If the marginal cost of the optimal quantity of this public good is $10, the optimal quantity must be: 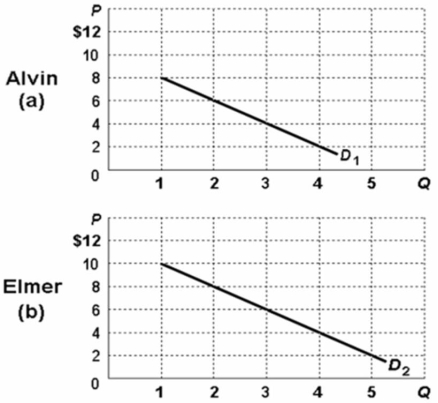
A) 1 unit.
B) 2 units.
C) 3 units.
D) 4 units.
Correct Answer:
Verified
Q20: A demand curve for a public good
Q54: The following information is for a public
Q55: The right and efficient amount of a
Q56: The following information is for a public
Q57: Ed, Mike, and Scott are the only
Q61: Answer the question based on the following
Q62: Refer to the supply and demand graph
Q63: Refer to the information below: 
Q64: Refer to the supply and demand graph
Q67: Suppose that Mick and Cher are the
Unlock this Answer For Free Now!
View this answer and more for free by performing one of the following actions

Scan the QR code to install the App and get 2 free unlocks

Unlock quizzes for free by uploading documents