Refer to the graph given below. 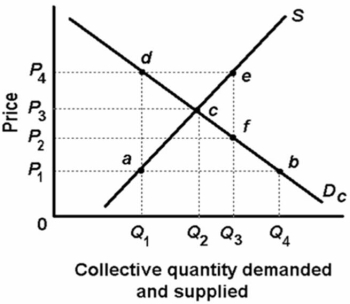 The graph above shows the supply of and the demand for a public good.Which of the following statements is correct?
A) The supply curve reflects the marginal cost of producing each unit of the good, and the demand curve reflects the marginal benefit of consuming each unit of the good.
B) The demand curve reflects the marginal cost of producing each unit of the good, and the supply curve reflects the marginal benefit of consuming each unit of the good.
C) There will be an overallocation of resources at output level Q1.
D) There will be an underallocation of resources at output level Q3.
Correct Answer:
Verified
Q67: The following data are for a series
Q68: The following information is for four highway
Q69: Answer the question based on the following
Q70: Examples of quasi-public goods include:
A)education.
B)highways.
C)museums.
D)all of the
Q71: A negative externality or external cost occurs
Q73: Answer the next question on the basis
Q74: Answer the next question on the basis
Q75: Refer to the supply and demand graph
Q76: The following information is for four highway
Q77: Answer the question based on the following
Unlock this Answer For Free Now!
View this answer and more for free by performing one of the following actions

Scan the QR code to install the App and get 2 free unlocks

Unlock quizzes for free by uploading documents