The graphs below refer to two separate product markets.Assume that society's optimal level of output in each market is Q0 and that government purposely shifts the market supply curve from S to S1 in diagram (a) and from S to S2 in diagram (b) .The shift of the supply curve from S to S2 in diagram (b) might be caused by a per unit: 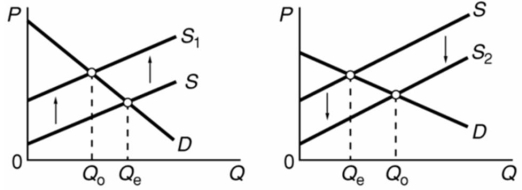
A) subsidy paid to the producers of this product.
B) tax on the producers of this product.
C) subsidy paid to the buyers of this product.
D) tax on the buyers of this product.
Correct Answer:
Verified
Q112: Refer to the below competitive market diagram
Q113: The graphs below refer to two separate
Q115: Refer to the information below.Which of the
Q116: The creation of markets for pollution rights
Q118: Refer to the below supply and demand
Q119: With MB1 and MC1, society's optimal amount
Q120: Which one of the following might shift
Q121: When the full cost of producing a
Q122: Consumer surplus and producer surplus can:
A)occur simultaneously.
B)are
Q144: If the production of a product or
Unlock this Answer For Free Now!
View this answer and more for free by performing one of the following actions

Scan the QR code to install the App and get 2 free unlocks

Unlock quizzes for free by uploading documents