Refer to the diagram, which shows three demand curves for coffee.Which of the following would cause the change in the demand for coffee illustrated by the shift from D1 to D2? 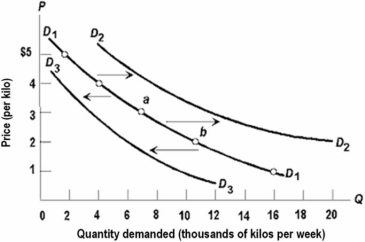
A) a decrease in the price of tea
B) an increase in consumer incomes
C) an increase in the price of sugar
D) a technological improvement in the production of coffee
Correct Answer:
Verified
Q39: When the price of a product rises,
Q40: The horizontal axis of a graph which
Q41: By an "increase in demand" we mean:
A)that
Q42: When economists say that the demand for
Q43: An inferior good is:
A)one whose demand curve
Q45: An economist predicts that in a bicycle
Q46: If consumers are willing to pay a
Q47: Graphically, the horizontal sum of all individual
Q48: Which of the following would usually be
Q49: A shift to the right in the
Unlock this Answer For Free Now!
View this answer and more for free by performing one of the following actions

Scan the QR code to install the App and get 2 free unlocks

Unlock quizzes for free by uploading documents