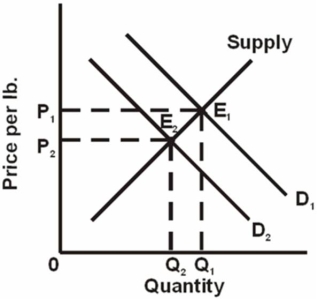
 Refer to the above graph, which shows the market for chicken where D1 and D2 represent different demand curves.A change from E1 to E2 is most likely to result from:
A) an increase in expectations of higher future prices for chicken.
B) an increase in the cost of chicken feed to produce chickens.
C) a decrease in the price of beef products.
D) an increase in consumer incomes.
Correct Answer:
Verified
Q34: Tennis rackets and ballpoint pens are:
A) substitute
Q91: If products A and B are complements
Q92: Refer to the diagram, which shows demand
Q94: Which are not generally considered to be
Q95: Which of the following would not shift
Unlock this Answer For Free Now!
View this answer and more for free by performing one of the following actions

Scan the QR code to install the App and get 2 free unlocks

Unlock quizzes for free by uploading documents