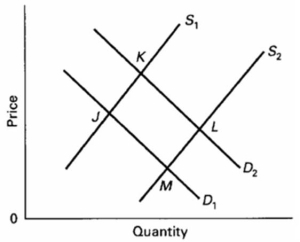
 Refer to the above diagram, in which S1 and D1 represent the original supply and demand curves and S2 and D2 the new curves.In this market the indicated shift in demand may have been caused by:
A) a decline in the number of buyers in the market.
B) a decline in the price of a substitute good.
C) an increase in incomes if the product is a normal good.
D) an increase in incomes if the product is an inferior good.
Correct Answer:
Verified
Q104: Productive efficiency refers to
A) the use of
Q189: When an economy achieves both allocative and
Q191: Because of their scarcity, the efficient use
Q192: You are asked to determine, other things
Q193: The concept of economic efficiency is primarily
Q195: A news story states that "Videotapes lose
Q196: In the corn market, demand often exceeds
Q197: A headline reads "Gasoline Prices Are Higher."
Q198: An "increase in efficiency" suggests that an
Q199: ![]()
Unlock this Answer For Free Now!
View this answer and more for free by performing one of the following actions

Scan the QR code to install the App and get 2 free unlocks

Unlock quizzes for free by uploading documents