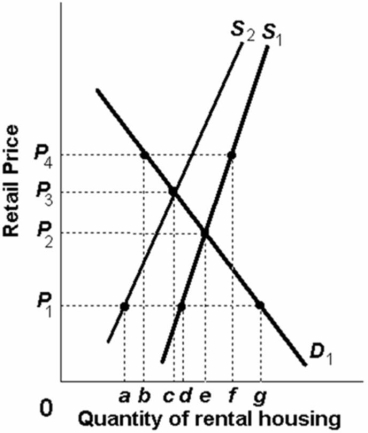
 Refer to the above graph, which shows the supply and demand for rental housing in a city.Given the demand D1 and the supply S1 for rental housing, if the government established rent controls in the city at below the equilibrium, then the price of housing would most likely be at:
A) P1 and there would be a shortage of rental housing.
B) P2 and there would be a shortage of rental housing.
C) P3 and there would be a surplus of rental housing.
D) P4 and there would be a surplus of rental housing.
Correct Answer:
Verified
Q147: Price floors and ceiling prices:
A) both cause
Q157: An effective ceiling price will:
A) induce new
Q257: A decrease in demand and an increase
Q258: Students at Informed University pay $40 per
Q259: What combination of changes in supply and
Q261: If an effective legal ceiling is imposed
Unlock this Answer For Free Now!
View this answer and more for free by performing one of the following actions

Scan the QR code to install the App and get 2 free unlocks

Unlock quizzes for free by uploading documents